Background
Following my Ph.D., I obtained a post-doc position with the Middlesex University's Interaction Design Centre (IDC) on the Making Sense project. While my primary responsibility was with the Making Sense project, I also contributed towards the IDC's flagship visual analytics platform INVISQUE as well as be part of the Middlesex University's VAST Challenge team. I was with the IDC from November 2010 to October 2013, when I returned to Australia following the conclusion of my three-year fellowship. My IDC staff blog is still up but of course no longer actively maintained.
Project Description
Making Sense
Making Sense was an EPSRC funded research project. The key challenge that the Making Sense project proposed to addresses was the identification of terrorist activity based on multiple sources of multimodal data that may be partial, unreliable and contradictory.
While at Middlesex University, I worked primarily on the System Architecture and Specification (SAR) work package. In this capacity, I research and developed architecture suitable for a visual analytics system. This architecture was implemented in INVISQUE and also used to power the Middlesex University entires into the VAST Challenges in 2011 and 2012.
INVISQUE
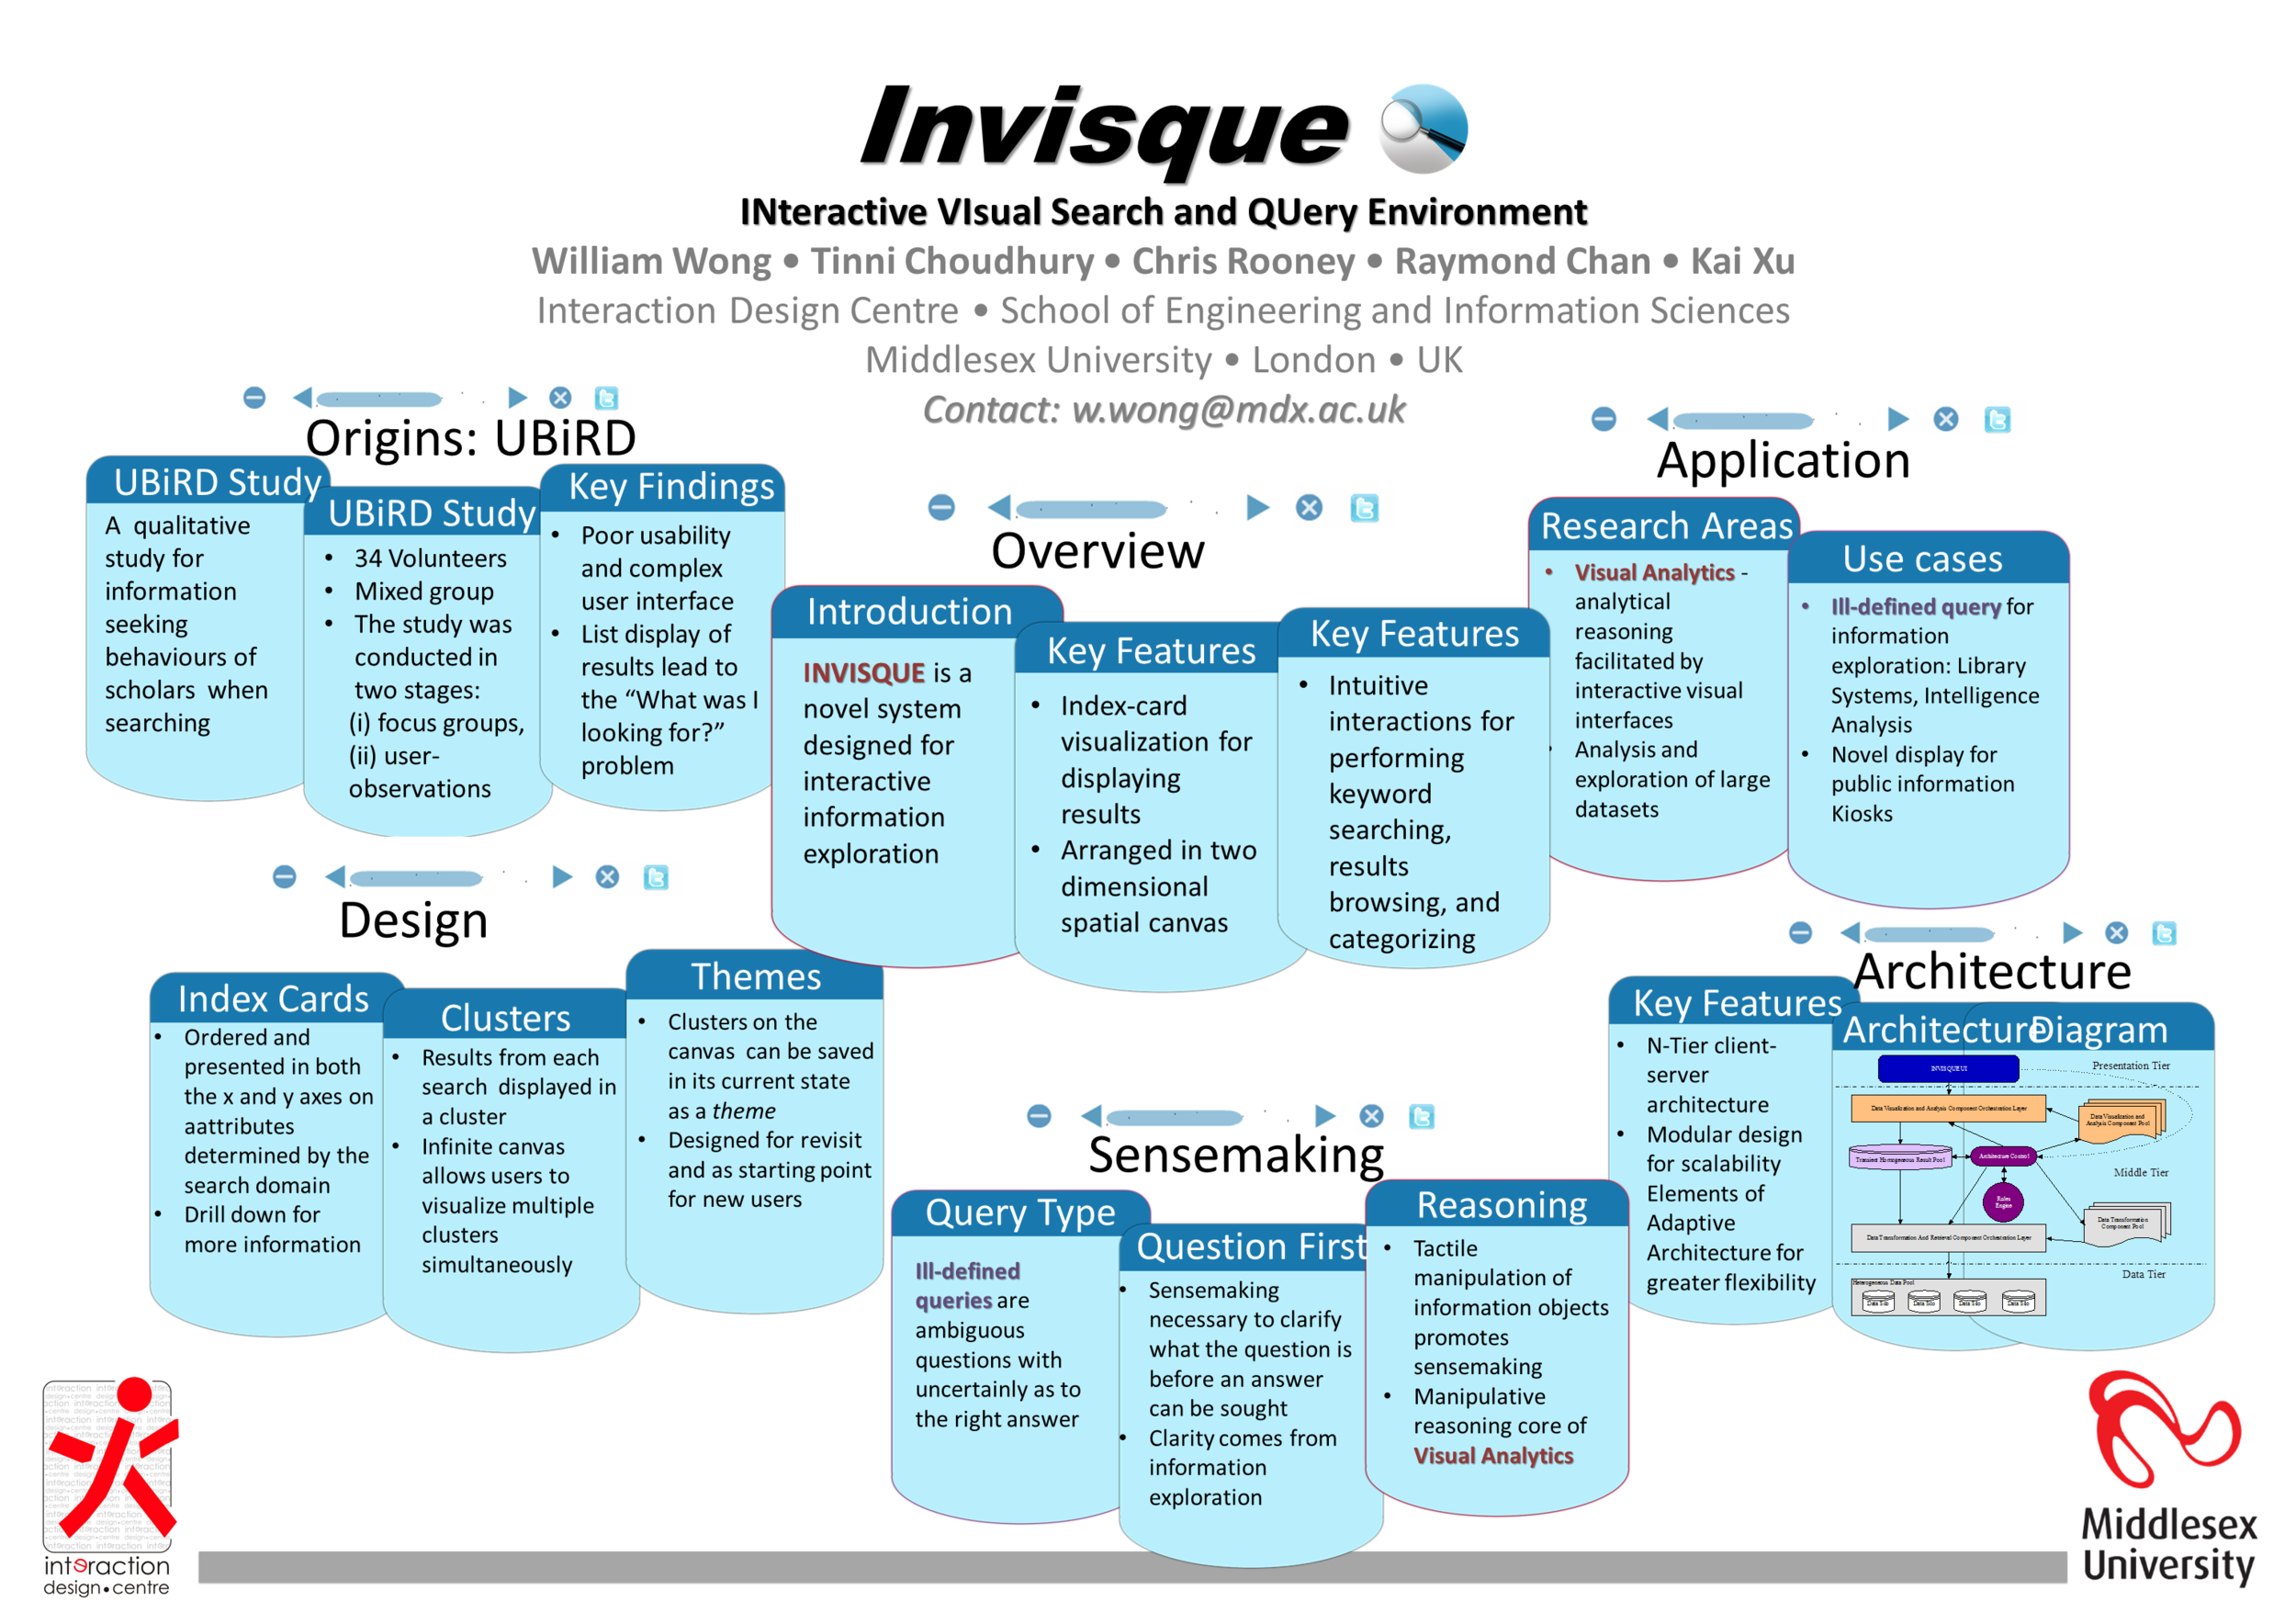
Poster for Invisque made for CHI 2011
During my time in Middlesex, INVISQUE was the university's flagship visual query and visual analytics environment. My involvement with INVISQUE involved researching and developing the middleware and backend of the system. The system then served as a proof-of-concept demonstrator for the Making Sense project as well as a starting point for the University's investigation into Sensemaking. I also contributed to investigating in reference to sensemaking in the context of intelligence analysis, mainly through my research and development of the INVISQUE system.
VAST Challenges
The VAST Challenge is organised by the VA Community and held in conjunction with VIZ Week. While I was with Middlesex University, I took part in the VAST Challenge in 2011, 2012 and 2013. My roles in all three project were as team coordinator, programme and system designer.
VAST Challenge 2011
The 2011 challenge concerned happening in the fictional city of Vastropolis. For this challenge, the participants were tasked with uncovering potential terrorist activity in Vastropolis from synthetic databases of tweets and news articles.
For this year, the Middlesex teams took on Mini-Challenge 1 - Characterization of an Epidemic Spread (MC1) and Mini-Challenge 3 - Investigation into Terrorist Activity (MC3). I primarily worked on MC3, although I contributed to MC1 as well.
For MC3, I coordinated efforts between the Middlesex Team and our Making Sense partners Leeds University to enable INVISQUE to be used to investigate a dataset for the challenge. Our investigation was partially successful but we were unable to fully uncover the mystery embedded with the news article dataset.
VAST Challenge 2012
That year, we took part in mini-challenge 1. This was the year the VA Community focused on the big data. As such, for MC1 we were given a database consisting of two tables. The first table contained 888,977 rows of data and the second table consisted of 158,530,955 rows of data for fictional bank network.
For this challenge, I along with my colleague Neesha Kodagoda worked with Cyber Security experts within Middlesex University to develop the Concern Level Assessment (CLA). CLA was developed as a method of reducing cognitive load on users when dealing with the big dataset.
I also assisted in the coding of the visual analytics system, that we named M-Sieve, we developed for the project. My contribution specifically was in writing modules to calculate the CLA and integrating CLA display mechanisms with the M-Sieve main interface.
This was our most successful year as for our innovative use of the CLA, we were awarded the Subject Matter Expert's Award. As such, we were asked to present our work at Viz Week 2012. Furthermore, we were also invited to submit a journal article to a special issue of Information Visualization.

Poster for VAST Challenge 2012
VAST Challenge 2013
Our 2013 entry was for Mini-challenge 2 Situation Awareness Display Design that involved the design of situation awareness display for a big screen. There was no programming involved for this challenge and as such, my primary contribution was in assisting in the development of the display design. I also narrated the video for our entry and as always, helped coordinate the our team. In addition, we also brought into our design the Concern Level Assessment (CLA) we developed for the 2012 VAST Challenge.
Teaching
I undertook limited teaching activities while with the Middlesex University. I mentored a final year student during a year-long research project. I also guest lectured on XML and hosted a workshop for masters students on big data. Finally, I was one of the hosts of a sketching design exercise for visual analytics during the Visual Analytics Summer School (VASS).
Project Outputs
- Architecture for INVISQUE that lead to working prototype.
- Concern Level Assessment (CLA) that formed the basis for further sensemaking work by Middlesex University.
- General architecture paradims for visual analytics systems
Publications
Peer-reviewed Journal Publications
C. Rooney, S. Attfield, B.L.W Wong, S. Choudhury , “INVISQUE as a Tool for Intelligence Analysis: The Construction of Explanatory Narratives”, International Journal of Human-Computer Interaction Vol. 30, Iss. 9, 2014
N. Kodagoda, S. Attfield, T. Choudhury, C. Rooney, G. Mapp, P.H Nguyen, L. Slabbert, B.L.W Wong, M. Aiash, Y. Zheng, K. Xu, and A. Lasebae, “Concern level assessment: Building domain knowledge into a visual system to support network-security situation awareness”, Information Visualization, 2013
N. Kodagoda, S. Attfield, B.L.W Wong, C. Rooney, S. Choudhury, “Using Interactive Visual Reasoning to Support Sense-Making: Implications for Design”, IEEE Transactions on Visualization and Computer Graphics, Vol 19, Number 12, 2013
Peer-reviewed Conference Papers
B.L. W. Wong, N. Kodagoda, C. Rooney, S. Attfield and S. Choudhury, “Trialling the SMART approach: identifying and assessing sense-making”, In: 2013 International Annual Meeting of the Human Factors and Ergonomics Society, San Diego, California, USA.
N. Kodagoda, S. Attfield, B.L.W. Wong, C .Rooney, S. Choudhury “Using Interactive Visual Reasoning to Support Sense-Making: Implications for Design Visualization and Computer Graphics”, IEEE Transactions on 19 (12), 2217-2226
S. Choudhury, N. Kodagoda, P. Nguyen, C. Rooney, S. Attfield, K. Xu, Y. Zheng, B.L.W. Wong, R. Chen, G. Mapp, L. Slabbert, M. Aiash, A. Lasebae, “M-Sieve: A visualisation tool for supporting network security analysts,” VAST 2012 Mini Challenge 1 Award: “Subject Matter Expert’s Award” in IEEE VAST 2012 Conference (part of VisWeek 2012)
S. Choudhury, C. Brierley, K. Xu, R. Chen, and W. Wong, “Investigation into Terrorist Activity: VAST 2011 Challenge,” in Advances In Visual Methods For Linguistics (AVML), 2012.
S. Choudhury, C. Brierley, K. Xu, R. Chen, and W. Wong, “Middlesex University ’ s Invisque Visual Analytics Tool : Supported by Text Analytics Techniques from the University of Leeds,” in IEEE VAST 2011 Conference (part of VisWeek 2011), 2011.
S. Choudhury, “A proposal on leveraging workflow technology for building process aware visual analytics system,” in The Third International UKVAC Workshop on Visual Analytics (VAW), 2011.
B. L. W. Wong, S. Choudhury, C. Rooney & R. Chen INVISQUE : Technology and Methodologies for Interactive Information Visualization and Analytics in Large Library Collections. In S. Gradmann, F. Borri, C. Meghini, & H. Schuldt (Eds.), Research and Advanced Technology for Digital Libraries (pp. 227-235). Berlin, Germany: Springer Berlin / Heidelberg. doi:10.1007/978-3-642-24469-8_24
W. B. L Wong & S. Choudhury. Tactile Reasoning and Adaptive Architecture for Intelligence Sense-Making. NATO Information Systems Technology (IST) Panel Symposium on “Emerged/Emerging ‘Disruptive’ Technologies (E2DT).” Madrid, Spain: NATO Information Systems Technology (IST) Panel.
K. Xu, Co. Rooney, S. Choudhury, R. Chen, W. Wong, C. Brierley, & E. Atwell, (2011). MAPINVIS & INVISQUE — Visual Analytics of Epidemic Spread in Vastropolis. IEEE VAST 2011 Conference (part of VisWeek 2011).
Other Publications
S. Choudhury, “Datasets for Visual Analytics Research”, IVAC Newsletter, 2011